

Table of Contents
** Minutes
What are distribution metrics?
Distribution metrics vs. key performance indicators (KPIs)
14 top distribution metrics to start tracking
How to track your distribution metrics
Track important metrics while delivering fast, affordable shipping
Key Takeaways
1
Distribution metrics are quantitative measures used to track performance in inventory management, warehousing, and shipping processes, helping businesses optimize their supply chain operations.
2
Key distribution metrics include inventory turnover rate, order accuracy rate, time to ship, and total units in storage, which are crucial for managing costs and meeting customer expectations.
3
Metrics differ from KPIs as they track ongoing processes, while KPIs measure the achievement of specific outcomes and influence service-level agreements with vendors.
4
ShipBob offers a comprehensive analytics tool that provides real-time tracking of distribution metrics, enabling businesses to make data-driven decisions and improve operational efficiency.
Companies across all industries use metrics to track performance over time so they can:
- Identify trends and opportunities for improvement
- Compare their volume and efficiencies to historical numbers
- Benchmark themselves against competitors
Every function of a business needs to track performance metrics including customer service, marketing, finance, HR, IT, supply chain management, and more.
For brands that sell physical goods, distribution logistics need to run efficiently.
Knowing the right performance metrics to track along with best practices for measuring success helps ensure you understand inbound and outbound logistics performance and that you can make the right supply chain optimizations.
In this article, we’ll cover common distribution metrics as they relate to fulfillment logistics, product sales, and inventory movement to help you maximize efficiencies.
What are distribution metrics?
Distribution metrics are the quantitative measures tracked throughout the inventory receiving, warehousing, picking, packing, ecommerce shipping, and delivering processes.
Distribution metrics vs. key performance indicators (KPIs)
Though often used interchangeably, metrics and KPIs have both overlap and key differences. Retail KPIs, for example, are meant to measure if a desired value or outcome is being achieved or not, while metrics simply track what is happening throughout the supply chain.
KPIs also influence service-level agreements (SLAs) that you have with vendors. For example, if you work with a third-party logistics (3PL) company, there are key metrics that are tracked so the 3PL is held accountable against their agreed upon SLAs. These SLAs can range from shipping orders out on time, to the speed at which they receive and stow your inventory.
14 top distribution metrics to start tracking
There are dozens of metrics and KPIs when it comes to tracking ecommerce logistics performance. The most important metrics you focus on impact everything from your profitability to your ability to meet customer expectations.
Here are 14 distribution metrics you should be tracking.
1. Inventory turnover rate
Inventory turnover rate measures how many times inventory is sold and then replaced in a specific time period. Understanding your average inventory turnover by SKU is a critical measure of business performance, cost management, and sales, and can be benchmarked against other companies in a given industry.
Inventory turnover = (Cost of goods sold / Average inventory)
“ShipBob’s analytics tool is really cool. It helps us a lot with planning inventory reorders, seeing when SKUs are going to run out, and we can even set up email notifications so that we’re alerted when an SKU has less than a certain quantity left. There is a lot of value in their technology.”
Oded Harth, CEO & Co-Founder of MDacne
2. Order accuracy rate
The percentage of orders that are delivered correctly. ShipBob’s order accuracy rate is usually around 99.98%.
Order accuracy rate = (Total orders delivered correctly / Total orders) x 100
3. Time to ship
This is the amount of time it takes to ship an order once it’s placed. For example, ShipBob offers same-day shipping for B2C orders imported into the ShipBob dashboard by the time of the outbound fulfillment SLA cutoff (ranging from noon to 6pm local time of the fulfillment center fulfilling it, depending on the location).
Time to ship = Ship date – Date order was placed
Note: For most brands, this distribution metric will be calculated in business days. This metric is also different from the time it takes an order to ship (from when it leaves a fulfillment center) to when it is delivered to the end customer.
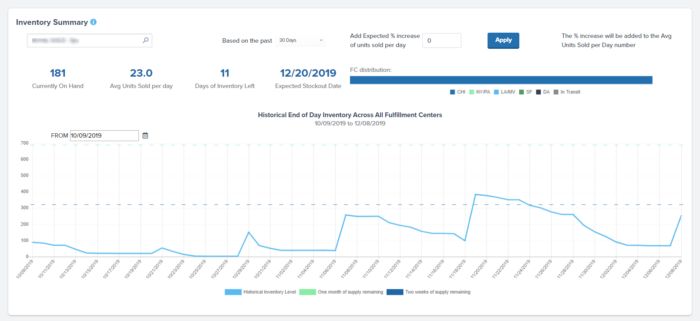
4. Total units in storage
This number involves knowing real-time inventory counts across all of your products.
Total units in storage = The sum of current stock levels for all SKUs
This distribution metric will change all the time as you sell through inventory, reorder more, add new products, and process ecommerce returns. However, understanding the quantity you have (either too little or too much) will affect everything from high warehousing costs and having too much money tied up in inventory, to experiencing stockouts. The more SKUs you have, the more you’ll have to stay on top of.
Note: You should also calculate reorder points and safety stock, and understand when to adjust your reorder quantity over time. This way, you can keep stock levels balanced, and never run out of inventory or invest in too much capital in inventory upfront.
5. Total number of orders
This is your total order volume for a given timeframe. A month or 30 days is a typical timeframe, but this can be calculated daily, quarterly, annually, etc.
Total number of orders = The sum of all orders placed for a specific timeframe
Note: Seasonality will affect this volume and you should track other distribution metrics like average order value (AOV) and average units per order in conjunction. You should also track this distribution metric separately for each channel so you can view growth per channel.
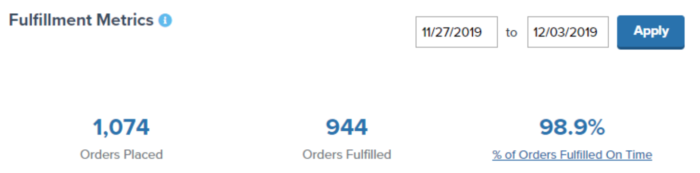
6. Percentage of on-time shipments
This is the total percentage of shipments that are delivered without delay or within their expected timeframe.
On-time shipments ratio = (Number of shipments delivered on-time / Total shipments) x 100
7. Average warehouse capacity used
This is the total bin, shelf, and pallet locations you have in your ecommerce warehouse that are being used so you can identify capacity. This distribution metric is useful in determining if you need to downsize or plan to expand warehouses. It goes hand in hand with economic order quantity, where you aim to optimize the space used.
Average warehouse capacity used = The number of inventory storage spots with an on-hand quantity greater than zero / Total number of inventory storage spots
Note: If you outsource fulfillment, this won’t apply to you. This metric is often used when warehouses consider on-demand warehousing or are deciding what to do when their lease is coming to an end.
8. Percentage of sales lost to out-of-stock products
This is the total dollar value of sales lost or refunded due out-of-stock supply issues divided by the total dollar value of customer sales over the same period of time, expressed as a percentage. If you have poor inventory management, you may over-sell products when you don’t actually have them in stock. After a customer places an order with out-of-stock items, you’ll have to let them know, cancel and refund their order, and lose that sale.
Sales lost = (Value of sales lost / Total value of sales) x 100
9. Order picking accuracy
Similar to order accuracy rate which takes packing and not just warehouse picking into consideration, this is the percentage of orders picked without error.
Order picking accuracy rate = (Total orders picked without error / Total orders) x 100
10. Undamaged delivery rate
This is the percentage of orders delivered without any shipping damages while in transit.
Undamaged delivery rate = (Orders delivered without damage / Total orders delivered) x 100
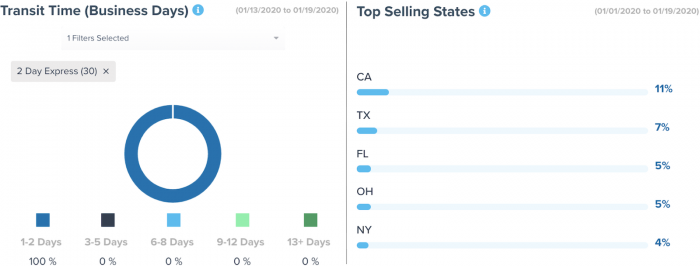
11. Average delivery days
Also known as average transit time, this it the average number of days it takes shipping carriers to deliver orders.
Average delivery days = (Total days to deliver all orders / Total number of orders delivered)
A few notes:
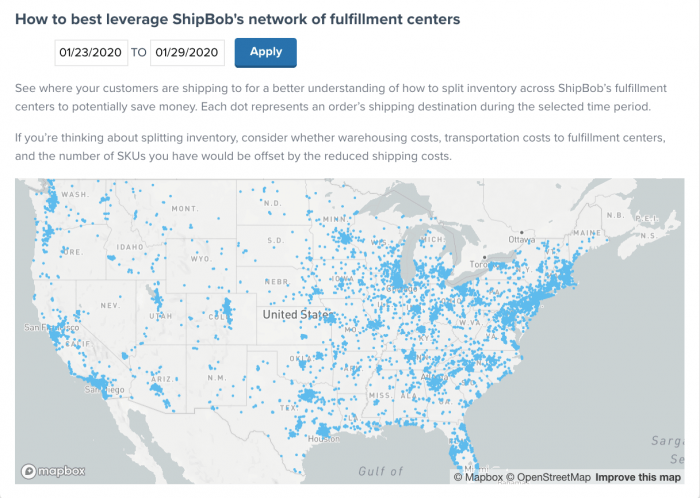
- The more fulfillment centers you split your inventory across, the lower this number will be. If you know which states or regions you are shipping to most often, you can optimize the fulfillment locations you ship from to further reduce shipping zones, costs, and transit times.
- Expedited shipping and services like 2-day shipping help keep this distribution metric lower as well.
- International shipping will usually cause this number to be much higher.
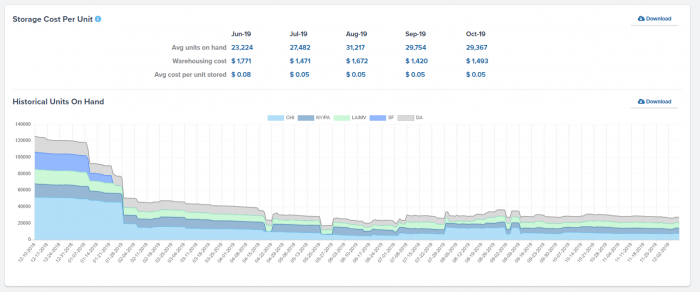
12. Average storage cost per unit
This is the average cost of storing each unit of inventory (across all SKUs).
Average storage cost per unit = Average units on hand / Total warehousing costs
Note: The larger the product(s) you sell, the more units you have on hand, and the higher your SKU count, the higher this figure will be.
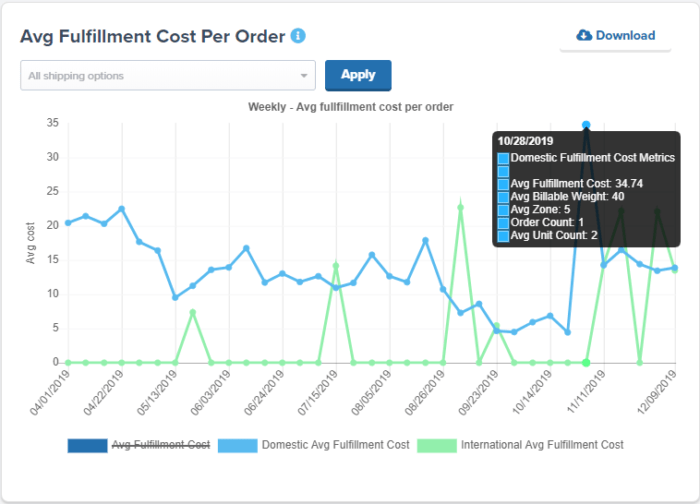
13. Average fulfillment cost per order
While you should also know how to calculate cost per order, this it the average cost of fulfilling each order. This distribution metric lets you know the base cost of order fulfillment to determine if you can reduce it and save money.
Average fulfillment cost per order = Total fulfillment cost across orders / Total number of orders
14. Total number of distribution centers
This is the total number of distribution centers you own or lease, or the total you store inventory in through your 3PL.
Total number of distribution centers = Sum of all facilities that you store inventory in and ship orders out of
Note: This will be only one for the majority of small businesses, but as you grow, expand your reach, and want to reduce shipping costs and/or speed up deliveries to customers, you may choose to split your inventory and even utilize an international fulfillment strategy.
“Now we’re at two fulfillment centers, and being able to have the analytics and see how everything is working together has been extremely helpful for me on the operations end. It definitely helps me with inventory management and see what’s going on. It truly helped us on a day-to-day basis. Even though we’ve grown, I haven’t spent more time on the business from an operations standpoint.”
Dana Varrone, Director of Operations at Organic Olivia
How to track your distribution metrics
Most inventory management software provides built-in reporting and distribution metrics (including ShipBob’s free fulfillment software merchants get when using our fulfillment services).
If you don’t have technology at your disposal, you’ll have to gather data from different systems and track distribution metrics in a spreadsheet to view performance over time.
With ShipBob
When you outsource fulfillment to ShipBob, an easy way to track distribution metrics is through ShipBob’s dashboard. ShipBob’s powerful analytics tools automatically tracks your most important distribution metrics.
In just a couple clicks, you can view all the metrics you want, apply filters, export reports, and gain new insights. Here’s how:
1. Jump into the Analytics dashboard
Once you log in to ShipBob, data will automatically populate in the Analytics tab.
2. Access all distribution metrics
You can track the following metrics through ShipBob’s analytics dashboard:
- Fulfillment SLAs & Exceptions: See the percentage of orders fulfilled on time, out of stock items, out-of-stock quantities, and more.
- Shipping Performance: Track transit time in days, top-selling states, and select shipping methods chosen at checkout to view their cart range as well as their average cart amount, shipping cost, and days in transit.
- Undelivered Shipments: View which orders our carriers have not yet delivered.
- Inventory On Hand: View current inventory on hand at each fulfillment center and which inventory en route to our distribution center(s).
- Inventory Reconciliation: View the movement and ongoing balance of inventory (i.e., your on hand inventory checked against activity in our fulfillment centers).
- Daily Inventory History: Check how much inventory you were holding for any SKU at any ShipBob fulfillment center at any point in time.
- SKU Performance: View performance of your product(s) over time by channel sold.
- Inventory Planning: Visualize SKU velocity and days of inventory remaining on hand; input changes in order volume to calculate changes in inventory turnover.
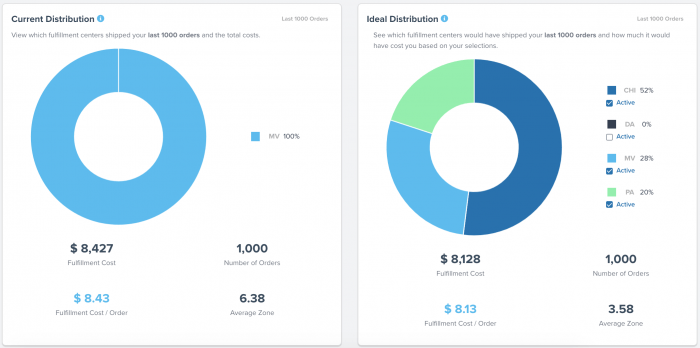
- Inventory Maps & Distributions: See your current distribution vs. ideal distribution in terms of fulfillment center locations to optimize shipping speeds and costs.
- Accounting & Billing Breakdown: View total monthly costs by fee type, an itemized record of charges for each month, average fulfillment cost per order, fulfillment cost per shipping option, and more.
- Accounting & Storage Costs: View storage cost per unit and a detailed storage billing summary.
“Overall, there is more transparency with ShipBob that even helps our team manage customer service better. I can see the granular stage the order is in — if it’s being picked, packed, in transit, etc. That enhanced visibility is great. No other 3PLs offer that in my experience. Tracking our costs and how much we’re spending on storage is a lot easier to understand.”
Wes Brown, Head of Operations at Black Claw LLC
Without ShipBob
In order to track inventory metrics without ShipBob, you’ll have to purchase software or rely on spreadsheets that are manually updated. Here’s how you can track metrics with spreadsheets:
- Create a spreadsheet with the appropriate tabs, rows, and column headers.
- Log into your logistics and shipping systems to gather the data you need. You can export the data or copy and paste to the spreadsheet.
- Update the spreadsheet with the required data (and continue with the same frequency going forward so you can track the exact points in time to identify trends).
- Create a new tab to show reports and charts as needed.
“With my old 3PL, I could never just open a page and get the info I wanted. I had to click several times, then export it, and try to make sense of it. ShipBob lets you manage your inventory while providing important data in a very digestible way.”
Wes Brown, Head of Operations at Black Claw LLC
Manually tracking metrics is easy when your business is just starting out. But if you’re fulfilling hundreds or thousands of orders per month and growing, manual tracking becomes much more complicated.
“At my previous 3PL, nothing seemed to come easy. Everything was done on spreadsheets and it was very difficult to get the fulfillment data I needed. Now, ShipBob seamlessly provides data to help us make business decisions. ShipBob’s analytics tool is a game-changer and it’s helped me grow my business tremendously. With ShipBob’s free analytics tool, it’s so easy for any of my team members to pull data in real-time.”
Courtney Lee, founder of Prymal
Track important metrics while delivering fast, affordable shipping
ShipBob is a tech-enabled 3PL that helps ecommerce businesses with retail fulfillment and logistics in our distribution centers to grow their business. When working with ShipBob, you get access to a distribution partner with powerful analytics and distribution metrics reporting that make it easy to track operational performance across our fulfillment centers.
We don’t use anyone else’s software. We built our own warehouse management system (WMS), which acts as a control center to compile all distribution metrics across all elements of our fulfillment centers. Our WMS tracks everything — from how many orders per hour a picker can pick to how long it takes to receive, count, and stow new inventory that arrives — to identify opportunities for improvement and learn from each of our fulfillment centers.
“I used to have to pull inventory numbers from three places everyday and move all the disparate data into a spreadsheet. ShipBob has an analytics tab in their dashboard with all of this information, which is great for end-of-month reconciliations.”
Wes Brown, Head of Operations at Black Claw LLC
Conclusion
Every business benefits from tracking KPIs and distribution metrics. When choosing the distribution metrics that make the most sense for your business to track, the goal should be to focus on the metrics that directly impact your bottom line and customer satisfaction. By tracking these metrics and finding out where there are opportunities to improve, you can help sustain your business and improve processes.
To learn how ShipBob can help with ecommerce fulfillment and managing ecommerce inventory while providing data on important cycle times and meeting key metrics, click the button below to learn more.
Have your own warehouse?
ShipBob has a best-in-class warehouse management system (WMS) for brands that have their own warehouse and need help managing inventory in real time, reducing picking, packing, and shipping errors, and scaling with ease.
With ShipBob’s WMS, brands with their own warehouse can even leverage ShipBob’s fulfillment services in any of ShipBob’s fulfillment centers across the US, Canada, Europe, and Australia to improve cross-border shipping, reduce costs, and speed up deliveries.


