

Table of Contents
** Minutes
How does an FSN analysis work?
The pros and cons of FSN analysis
Outsourcing fulfilment to ShipBob levels up your inventory management system
When you run an ecommerce business, you’re primarily concerned with if your products sell – but how and when they sell are just as important.
Some SKUS will sell out quickly, and barely spend time on shelves. Others won’t sell for a long time, and some will have a sales time somewhere in between. But how do you know which SKUs fall in which category?
You might have a gut feeling or a vague idea of which SKUs are fast-movers and which aren’t – but these senses can be wrong. If you want to make the best and most informed decisions about inventory flow, inventory reduction, and assortment planning, you’ll need to collect raw data through an FSN analysis.
In this article, we’ll dive deep into what an FSN analysis is, why it’s important, how it works, and even the pros and cons of conducting one on your own inventory.
What is FSN analysis?
FSN analysis refers to an inventory management technique which divides goods into three categories – fast-moving, slow-moving, and non-moving – based on how fast they are used or sold and how long they stay in storage.
By conducting an FSN analysis, ecommerce businesses can easily identify dead stock and prevent it from accumulating. It also allows them to make strategic procurement decisions to save valuable warehousing and storage space, minimise holding costs, and better meet customer demand.
How does an FSN analysis work?
In an FSN analysis, a business classifies each of its SKUs into one of three categories:
- Fast-moving inventory – These SKUs sell quickly and do not remain in stock for long, meaning that they’re also replenished most often. Typically, fast-moving inventory has an inventory turnover ratio of at least 3 and accounts for less than 20% of the total inventory.
- Slow-moving inventory – These SKUs move more slowly through the supply chain and are replenished less often. They generally have an inventory turnover ratio between 1 and 3 and make up about 35% of the total inventory. Some surplus inventory may be included in this category.
- Non-moving inventory – These items rarely move (if at all) and have an inventory turnover ratio below 1. Non-moving inventory can constitute as much as 60-65% of the total inventory. It may include deadstock and other items that are ready for disposal.
To determine which products should be included in each category, every SKU is measured on 3 parameters:
- Consumption rate – The rate at which an item is consumed or expended during a specific period.
- Average stay – The average duration that a specific item stays in the warehouse until it’s sold.
- Period of analysis – The time period for which the analysis is being conducted.
The pros and cons of FSN analysis
FSN can be a powerful tool for ecommerce merchants, but it might not be a must. To better understand how an FSN analysis can add value to your ecommerce business, consider the following pros and cons.
Pros of FSN analysis
The biggest draw for FSN analysis is that it reveals which items move through the supply chain quickly, and which do not. This data is incredibly valuable, as it enables a brand to improve many different aspects of their inventory management, such as:
Timely inventory control
Because an FSN analysis takes every SKU into account, it forces a business to audit their inventory and evaluate their product mix, inventory levels, and more. This deeper visibility helps improve your inventory control, as it gives you the data you need to move deadstock and surplus inventory off your shelves and optimise stock levels.
Better procurement planning
When you know how long inventory is likely to stay on shelves before it sells, you are much more equipped to time inventory replenishment. An FSN analysis and its resulting insights enable you to plan procurement to avoid unnecessary purchases while quickly replenishing popular products. This is particularly helpful when navigating seasonal spikes and dips in demand, so that you don’t accidentally end up with more or less stock than you need.
Improved warehouse space utilisation
Warehouse space is expensive and usually limited. FSN analyses reveal which items are sitting in storage and taking up space, which in turn allows a merchant to take steps to free up that valuable square footage. This may involve reducing order quantities or frequencies for those items to prevent further accumulation, or moving them out altogether through heavy discounting, donations, or disposal.
On the other hand, fast-moving inventory can be stored in a more strategic location for easy access. This saves time for pickers and improves warehouse efficiency.
Increased profitability
Through an FSN analysis, you can improve your assortment planning to prioritize fast-moving items and optimise profit margins on those items to boost your bottom line. Similarly, you can identify which slow- or non-moving SKUs are tying up your capital and adjust purchase quantities to improve cash flow and overall profitability.
Effective cost reduction
An FSN can even help you save money. By showing you which SKUs are collecting dust in storage and aren’t reaping any ROI in sales, an FSN empowers you to move those items out and reduce your inventory carrying costs. That way, you’re not spending money on storage, insurance, and depreciation for non-moving items.
Cons of FSN analysis
Although the FSN analysis offers many benefits, there are a few caveats that you should consider. should be taken into consideration.
Potential for human error
The FSN technique is a form of SKU analysis that requires a person to provide their own data and perform formula calculations. This makes it susceptible to human error, which can result in miscalculations and faulty outcomes. Even a small error in the information provided could affect the accuracy of your results, meaning that there’s a higher risk of making decisions based on faulty information.
For instance, you might decide to order more units of a SKU that falls under a non-moving category because you accidentally categorized it as fast-moving. As a result, you’ll end up with excess stock that you can’t really get rid of.
Inconsistency with demand fluctuation
It’s difficult to keep up with sudden or frequent changes in trends using an FSN analysis alone. If you conduct your analysis at a time when a certain SKU is high in demand, it will naturally be categorized as fast-moving. However, if demand suddenly drops again by the time your replenishment inventory arrives, you’ll end up with a bunch of excess stock that’s difficult to sell.
How to calculate FSN
The FSN calculation process is complicated, and involves several formulae. Follow this step-by-step method to calculate FSN for your inventory.
Step 1: Calculate consumption rate for each SKU.
Start by making an itemized list of every SKU in your inventory. Next, calculate the consumption rate for each product.
To calculate this, you’ll need to use this formula:
Consumption rate = Total number of issued goods / Total period
For example, say the total number of issued goods for a certain pair of pants is 150 and the total period is 15 days. In this case, the consumption rate would be as follows.
Consumption rate = 150 / 15
Consumption rate = 10
Here, the consumption rate for this specific pair of pants is 10 units.
Step 2: Calculate the average stay for each SKU.
Next, calculate the average stay for each product.
To calculate this, you’ll need to use this formula:
Average stay = Cumulative number of days inventory is held / (Total number of goods received + Opening balance)
For example, say another pair of pants is held for a cumulative of 60 days and there were 20 units received with an opening balance of 10. In this case, the average stay for this pair of pants would be as follows.
Average stay = 60 / (20+10)
Average stay = 60 / 30
Average stay = 2
That means the average stay for this pair of pants is 2.
Step 3: Calculate the cumulatives for both parameters.
Once you have these numbers, you’ll need to calculate the cumulative consumption rate and cumulative average stay for each item.
Cumulative consumption rate
Cumulative consumption rate = Item consumption rate + Sum of consumption rates for all items consumed faster than the item in question
For example, say the consumption rate of a certain handbag is 9, but 3 different inventory items have higher consumption rates: 12, 15, and 16 respectively. In this case, the cumulative consumption rate can be calculated as:
Cumulative consumption rate = 9 + (12+15+16)
Cumulative consumption rate = 9 + 43
Cumulative consumption rate = 52
Cumulative average stay
Cumulative average stay = Item average stay + Sum of the average stays of all items staying longer in the inventory than the item in question
For example, say the average stay of a certain pair of shoes is 10 days, and the sum of the average stay of all items with longer average stay times is 25. In this case, the cumulative average stay can be represented in percentage as follows:
Cumulative average stay = 10+ 25
Cumulative average stay = 35
Step 4: Calculate the percentages for both cumulatives.
Next, calculate the percentages of both cumulative consumption rate and cumulative average stay for every SKU using two more equations.
Percentage cumulative consumption rate
Percentage cumulative consumption rate = (Cumulative consumption rate of item / Cumulative consumption rate of all items) x 100
For example, say the cumulative consumption rate of a certain handbag is 10, and the cumulative consumption rate of all items is 8. In this case, the percentage cumulative consumption rate can be calculated as follows:
Percentage cumulative consumption rate = (10 / 8) x 100
Percentage cumulative consumption rate = 1.25 x 100
Percentage cumulative consumption rate = 125%
Percentage cumulative average stay
Percentage cumulative average stay = (Cumulative average stay of item / Cumulative average stay of all items) x 100
For example, say the cumulative average stay of a certain pair of shoes is 10 days and the cumulative average stay of all items is 25. In this case, the percentage cumulative average stay can be calculated as follows:
Percentage cumulative average stay = (10 / 25) x 100
Percentage cumulative average stay = 0.4 x 100
Percentage cumulative average stay = 40%
Step 5: Create tables ranking SKUS by each percentage.
Next, it’s time to organise the items based on their percentage cumulative consumption rates and percentage cumulative average stay.
In one table, list all SKUs based on percentage cumulative consumption rate. Arrange them in ascending order of consumption, with the highest percentage of consumption at the bottom.
You will them classify each item based on its ranking:
- Top 70% of the list = fast-moving items (F)
- Middle 20% of the list = slow-moving items (S)
- Bottom 10% of the list = non-moving items (N)
In another table, list all SKUs based on percentage cumulative average stay. Arrange them in descending order, placing items with the highest average stays at the top.
You will them classify each item based on its ranking:
- Top 70% of the list = non-moving items (N)
- Middle 20% of the list = slow-moving items (S)
- Bottom 10% of the list = fast-moving items (F)
Step 6: Combine results to finalize FSN classifications.
Finally, it’s time to combine the two tables’ rankings and finalize your classification. Here’s how you can classify your inventory into three categories:
| Consumption rate ranking | Average stay ranking | Final ranking |
| F | F | F |
| F | S | F |
| F | N | S |
| S | F | S |
| S | S | S |
| S | N | N |
| N | F | N |
| N | S | N |
| N | N | N |
FSN analysis in action
To get a better sense of how an FNS analysis can add value to ecommerce operations, let’s take a look at a few scenarios where it can be used.
FSN analysis for stock control
In this scenario, a business has large volumes of unsold inventory that is no longer in demand and taking up valuable space in the warehouse. This prevents the business from procuring more inventory that could generate sales for them.
The business performs an FSN analysis to identify the items that are no longer moving. The process helps them to identify all the SKUs that are considered non-moving, and with that data, the business is able to:
- Prevent additional purchases of those non-moving items.
- Optimise cash flow.
- Free up space to make room for more inventory that could generate sales.
- Focus on procuring more items that could get sold quickly and generate revenue.
FSN analysis for optimised warehouse layout
In this scenario, a business is struggling with low pick rates because pickers have to travel long distances within the warehouse to retrieve fast-selling goods. The brand decides to conduct an FSN analysis to see how they can better arrange their inventory to reduce transit time. As they identify the fast-moving goods, they arrange them closer to loading areas, so pickers no longer have to travel long distances to retrieve them. This allows them to:
- Pick these fast-moving products more quickly, thus improving their pick rates.
- Minimise travel time, which improves picking efficiency.
- Quickly move these fast-moving products from storage to packing, which speeds up the fulfilment process.
- Ship out orders quickly, preventing fulfilment delays and increasing on-time shipments.
- Fulfil more orders in a day.
Outsourcing fulfilment to ShipBob levels up your inventory management system
Confused by FSN? Don’t feel bad – while this analysis is a great tool to help a merchant understand inventory flow, it can be very hard to master, time-consuming, and tedious to continuously repeat.
Luckily, there are other ways of monitoring inventory movement, and other tools for achieving inventory visibility.
Partnering with an expert ecommerce enablement platform like ShipBob, for example, enables brands to manage their inventory and balance stock levels from one place, with automatic, real-time analytics for easy insights.
Outsourced inventory management
When you outsource fulfilment to ShipBob, you hand off your inventory to a team of experts who can streamline the inventory management process for you.
ShipBob will receive and store your inventory across our fulfilment network, leveraging best practices to minimise waste and optimise for cost. This includes:
- Separating inventory based on expiration date and lot numbers to reduce the risk of inventory obsoletion and deadstock.
- Using the FIFO method to keep inventory moving through your supply chain.
- Real-time reorder notifications that alert a merchant when a SKU needs to be replenished.
- Leverages order allocation logic to ensure that orders are fulfilled using inventory from the most optimal fulfilment centre, based on costs, inventory availability, and proximity.
Real-time inventory visibility
Even though ShipBob stores your inventory for you, our proprietary software gives you deep inventory visibility at all times. Real-time inventory tracking and updates let you know where your inventory is at all times and how much inventory is left, ensuring that you get an accurate picture of your inventory levels.
That way, you can plan your procurement accordingly so that you never stock out of even your fastest-moving items.
“ShipBob has given us increased visibility thanks to the dashboard that allows us to easily manage stock and orders. That wasn’t possible for us before. Our relationship with ShipBob has been a game-changer for Quadrant, and it’s made my life so much easier. ShipBob is incredibly easy to use – that’s my favorite part about it.”
Will Kerr, Apparel Lead at Quadrant
Improved inventory analysis
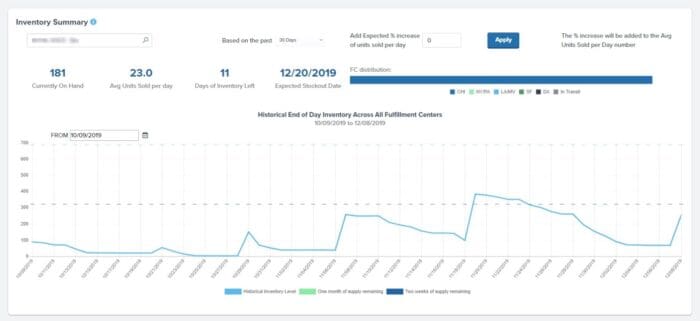
The ShipBob dashboard comes with powerful analytics so you can monitor your inventory data and make informed decisions. It helps you keep track of vital inventory management KPIs at the SKU level, including inventory turnover and SKU velocity.
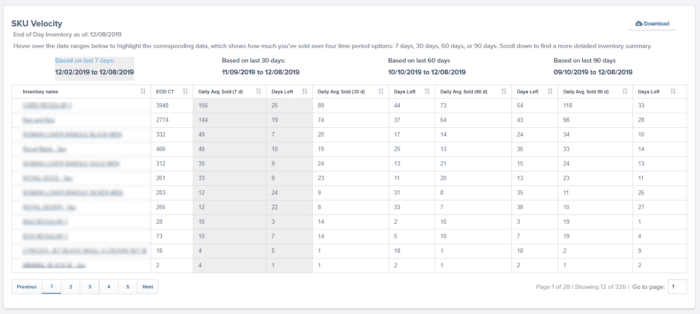
From a single dashboard, you can quicky gather vital information to produce more accurate, more timely insights – insights which you can use to improve your inventory management as a whole.
For more information on how ShipBob can improve your brand’s inventory management, click the button below.
FSN analysis FAQs
Below are answers to common questions about FSN analysis.
What is FSN analysis and how is it used in inventory management?

An FSN analysis is an inventory analysis technique where goods are categorized based on how quickly they’re consumed. It’s an effective method for identifying dead stock for inventory reduction and fast-selling items for procurement planning.
How does FSN analysis categorize inventory items?
An FSN analysis categorizes inventory items according to three levels of consumption – fast-moving, slow-moving, and non-moving.
What are the key factors considered in FSN analysis?
Average stay and consumption rate are the main factors considered in FSN analysis.
Can ShipBob’s inventory dashboards help with FSN analysis?
Yes, ShipBob’s inventory management software provides you with accurate and up-to-date inventory data, which can be used for conducting FSN analysis.


