Inventory Analytics Guide
Ecommerce inventory is an online brand’s most important asset.
Whether you are an established direct-to-consumer (DTC) brand, or you’re preparing to launch an online store, having a system in place to track and record inventory analytics can help you ensure your business is profitable.
In this article, we will discuss why inventory analytics is important, what metrics to track, and how a 3PL partner like ShipBob can help you streamline your inventory management process.
Request Fulfilment Pricing
Let’s talk. Our experts can help you boost your order volume by 30% year over year.
A fulfilment expert will get back to you shortly. Privacy Policy
What are inventory analytics?
Inventory analytics refers to tracking metrics that gauge the movement and performance of your physical products. The ongoing assessment and evaluation of inventory provides the insights needed to optimise stock availability to meet demand while keeping storage costs to a minimum.
Inventory analysis also helps reduce risks and common challenges related to inventory, such as stockouts or accumulating dead stock, and uses technology and processes to ensure inventory accuracy. It is a critical component of managing logistics operations and can help can improve inventory control, supply chain efficiency, and profitability.
How to analyse inventory
Analising data can be confusing because there is so much information to process and there are several ways to perform inventory analysis.
There are four common types of inventory analysis, and each one of them serves a different purpose and answers a different question. Inventory managers should know and understand these different types of data analytics in order to understand low and/or high performing areas.
Descriptive inventory analytics
Descriptive inventory analytics lays out your data so you have a comprehensive look at the past. This form of data analytics takes information from several sources and gives you holistic insight about your inventory trends. For example, descriptive inventory data would show you that your brand had more inventory prior to a holiday like Black Friday as compared to other months in the year.
Diagnostic inventory analytics
Diagnostic inventory analytics helps explain the why behind your data. This type of analysis takes a look into the past to help you comprehend why certain things occurred. Diagnostic inventory analysis can help you better understand why you’re seeing outliers, patterns, or certain correlations in your inventory data.
Predictive inventory analytics
Predictive inventory analytics looks to the future to help you anticipate trends. This type of analysis will take historical data into account so you can prepare for the future. Findings from this form of analysis can help you forecast inventory needs. This is especially useful when preparing for holidays or peak season.
Prescriptive inventory analytics
Prescriptive inventory analytics helps you fill in the gaps in your data so you have a better understanding of what actions to take. This type of analysis gives you suggestions for ways you can improve your brand’s inventory efficiency. Prescriptive inventory analysis can take your inventory and customer demand and propose changes to your safety stock, lot sizes, and more.
5 inventory analysis methods
Additionally, there are several common methods for analysis that will be helpful in painting a clear picture when it comes to your inventory. The various different methods serve a unique purpose, so the type of method you’ll use largely depends on your industry and the type of products you carry.
These five inventory analysis methodologies are the most commonly used today:
1. ABC analysis
“Always Better Control,” or ABC, analysis is one of the most popular analytics methods. By using this method, brands classify their inventory into categories based off of their consumption value and overall inventory cost:
A: Inventory classified as “A” is the most valuable and contributes to your profits the most. These items are usually the most expensive.
B: Inventory classified as “B” falls in the middle, between most valuable and least valuable. These items sell regularly but aren’t as popular as “A” items.
C: Inventory classified as “C” is the rest of your inventory. These items don’t sell as often and make up the majority of your inventory costs.
This type of analysis can help you determine if you have dead stock and can help with inventory turnover. To determine where your inventory falls, you can use this formula:
(Number of items sold) X (Cost per item) = annual usage value per product
2. HML analysis
HML analysis classifies inventory based on their cost: high, medium, or low. This methodology sorts your inventory into three groups:
H: Inventory with a high price per unit.
M: Inventory with a medium price per unit.
L: Inventory with a low price per unit.
3. VED analysis
VED analysis is a method that breaks inventory into three categories based on the user’s experience and perception: vital, essential, or desirable.
V: Vital inventory is made up of products that need to constantly be in stock for your business to do well.
E: Essential inventory is a group of products that are important to have in stock, but are only needed in minimal quantities.
D: Desirable inventory is a group of products that are optional for your business. Your business can function with or without these items.
4. SDE analysis
SDE analysis is based on inventory availability and therefore, lead time. Inventory is split into three categories: scarce, difficult, or easily available.
S: Scarce inventory is imported and requires a longer lead time.
D: Difficult inventory is more challenging to secure, requiring a lead time of over 14 days but less than 6 months.
E: Easily available inventory is accessible and readily available.
5. Safety stock analysis
Safety stock analysis is a way to calculate how much additional inventory you should have in stock to prevent stockouts. This form of analysis helps you mitigate risk and gives you a cushion for fluctuating demand or supply chain disruptions.
Which inventory metrics are important to track and analyse?
Ecommerce is an intensely competitive industry. To create a resilient supply chain and meet customer expectations, keeping track of inventory flow and performance throughout your supply chain is a critical part of inventory planning.
But what, exactly, do you track? There are several ways to approach inventory analytics, and the metrics you choose to track and measure depends on your brand’s unique needs and goals. However, there are a few that are essential. Below is an overview of key inventory metrics that are important to track and analyse.
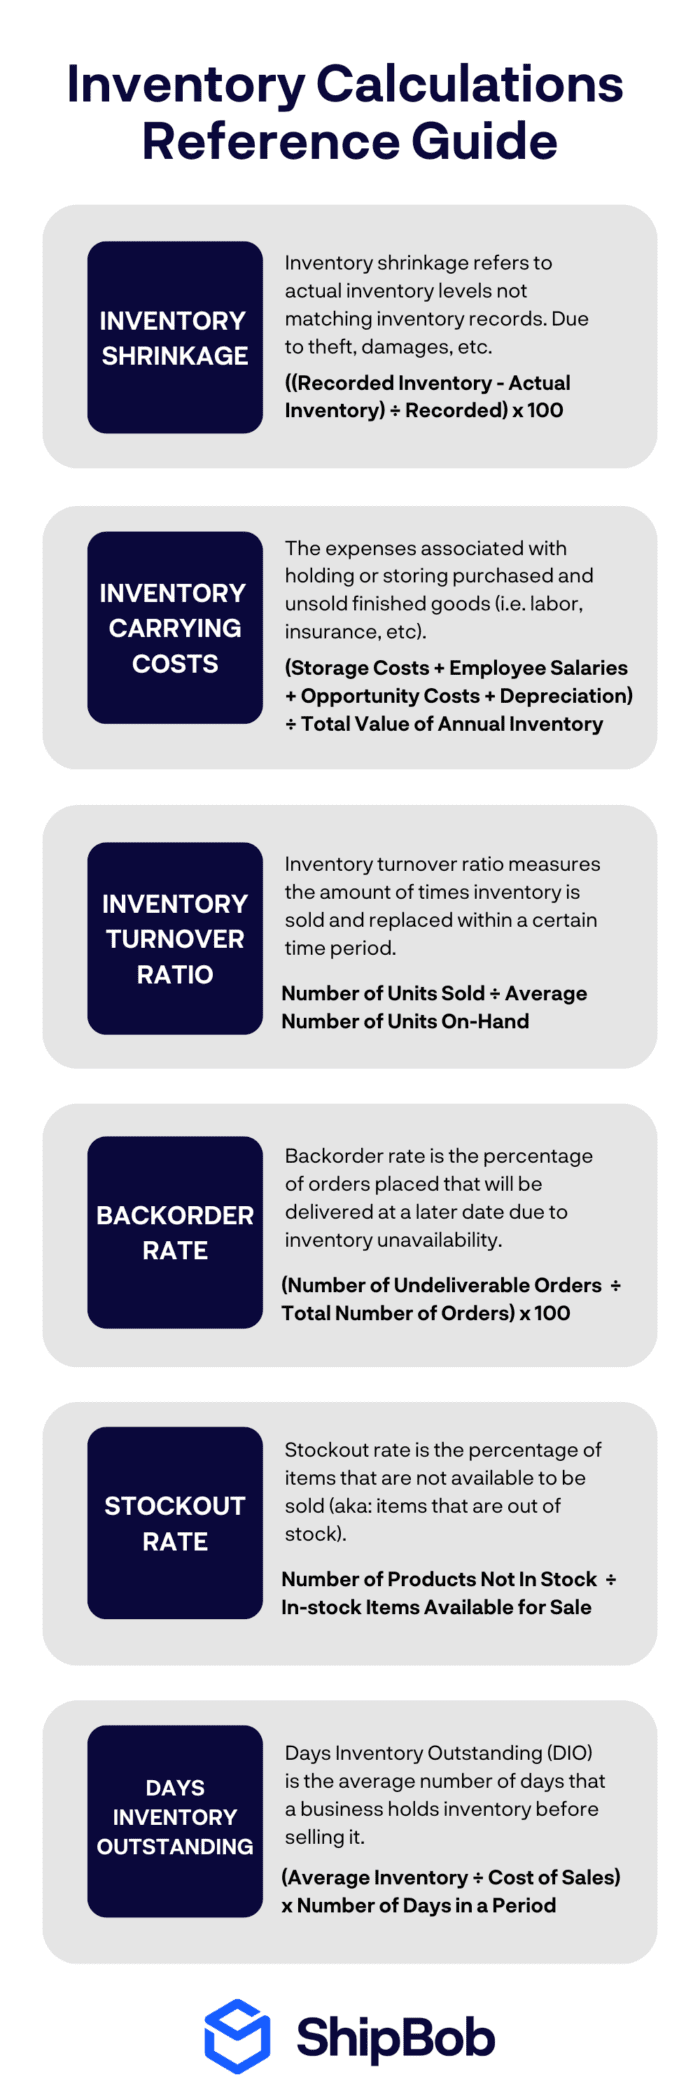
Inventory carrying costs
Carrying costs include all expenses associated with holding or storing purchased and unsold finished goods. Common carrying costs include warehousing, labour, and insurance, but it can also include opportunity and inventory depreciation costs.
Carrying costs make up around 30% of total inventory costs, and the actual costs vary since it depends on a variety of factors, from the number of total SKUs being stored to your average inventory turnover rate (i.e., how long inventory sits on the shelves before it’s sold).
To give you an idea of how carrying cost is calculated, add up all the expenses associated with inventory and divide the amount by your current inventory value to get a percentage of how much you’re really paying to hold inventory.
(Storage Costs + Employee Salaries + Opportunity Costs + Depreciation Costs) / Total Value of Annual Inventory
Inventory shrinkage
Inventory shrinkage is when actual inventory levels don’t match inventory records. There are several factors of why this is the case, including theft, shipping damages, or inventory accounting errors.
Shrinkage can be an unavoidable problem, but knowing the extent of the issue can help retailers gain more control over their inventory. By choosing an inventory valuation method and sticking with it can help create consistency and accuracy, which will save a lot of headaches during tax season.
Here is a formula to calculate inventory shrinkage rate:
((Recorded Inventory – Actual Inventory) / Recorded) x 100
Inventory turnover ratio
Inventory turnover rate is a measure of the number of times inventory is sold and replaced within a specific period. This metric is extremely valuable since it provides a lot of insight into how your inventory is performing and is influenced by sales.
To calculate the turnover ratio, divide COGS with average inventory value (beginning inventory + ending inventory / 2 ).
COGS for the accounting period / Average Inventory Value
You can also calculate your inventory turnover ratio by looking at units, rather than costs:
Inventory Turnover = Number of Units Sold / Average Number of Units On-Hand
To help you analyse the results, an inventory turnover ratio benchmark of 2 to 4 is ideal, but keep in mind that it can vary based on your industry.
A ratio within this range tells you that
- Your inbound and outbound logistics are optimised.
- You are restocking inventory that matches your sales cycle.
- You’re receiving new inventory on time based on production and warehousing receiving lead times.
Note: Inventory turnover is inversely proportional to days sales in inventory, which measures the number of days it takes to convert inventory into sold goods.
Backorder rate
A backorder is caused when a sale is made but the inventory for the order is not in stock yet. This delays the order fulfilment and shipping process, which also slows down last-mile delivery.
Since the item isn’t in stock, it’s delivered to the customer at a later date. Though backorders can occur due to high demand products, regular backordering can lead to poor customer satisfaction.
A company’s backorder rate shows the percentage of orders placed that will be delivered at a later date due to the lack of available inventory. And here is how you calculate it:
(Number of Undeliverable Orders/ Total Number of Orders) x 100
A high backorder rate can indicate an unusual shift in demand, a lack of safety stock, or manufacturing delays.
Inventory reconciliation
A process for inventory reconciliation helps reduce stock discrepancies and helps you better understand why there are discrepancies in the first place.
Accurate and timely inventory reconciliations should happen often to ensure that you’re tracking and recording shifts in value based on obsolete inventory or shifts in product demand.
Here is a brief overview of the steps to take to properly reconcile inventory:
- Check your physical inventory count.
- Compare physical count with inventory records.
- Look at recent inventory deliveries and shipments.
- Identify discrepancies.
Scheduling inventory reconciliations at regular, predetermined intervals is key to consistency and accuracy, but it can be time-consuming, especially if you lack inventory management software.
However, a 3PL partner that offers fulfilment services and inventory analytics can help make the process easier. For instance, ShipBob’s Inventory Reconciliation tool helps you track the movement and ongoing balance of inventory levels and pull custom reports.
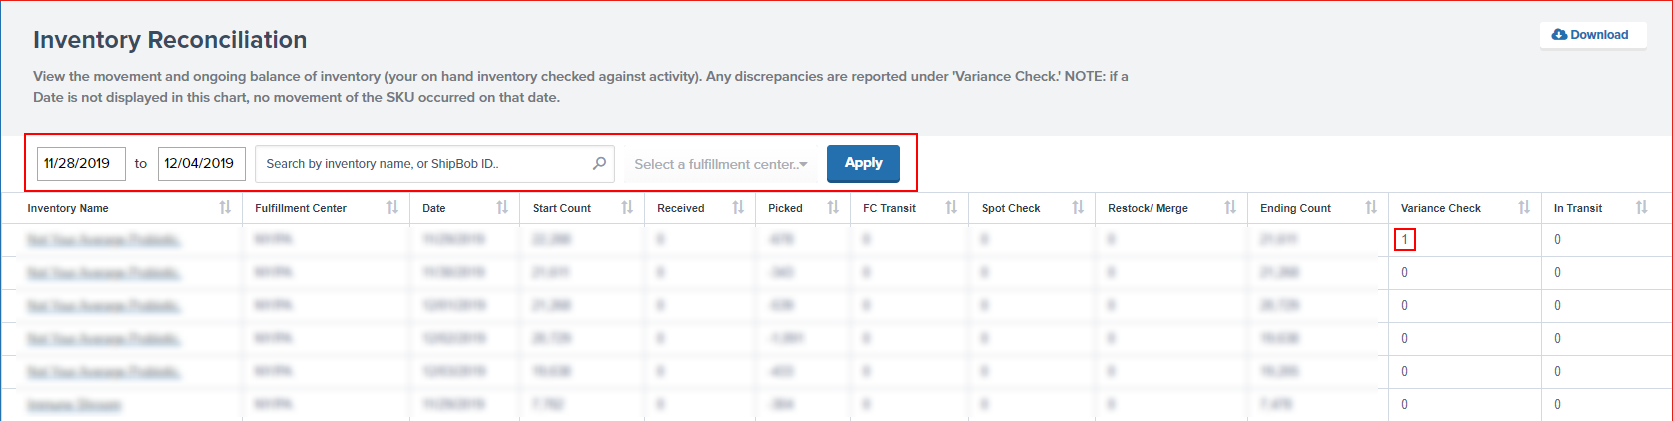
“ShipBob’s analytics tool has been great to have. We can see inventory reconciliations and easily view SKU velocity, transit times, and inventory distribution recommendations.”
Pablo Gabatto, Business Operations Manager at Ample Foods
Total units in storage
Real-time monitoring of inventory counts for all your products, across all fulfilment centres, can help you arrive at the total units in storage or total inventory.
This metric constantly fluctuates as you sell and reorder units, add new products, and process ecommerce returns.
The more SKUs you have, the more you need to be cautious about storage costs, overstocking, and capital tied up in inventory. Many businesses overpay for storage they don’t need, unnecessarily inflating their inventory holding costs.
If you manage your own warehouse, consider the following:
- You will likely over-pay for holding costs at the beginning as it will take time to grow into the warehouse and it’s a fixed cost, rather than a variable pay-as-you-go cost.
- Once you outgrow that space and need to expand into a larger warehouse, you’ll need to pay more for a larger storage space but also get new racks, equipment, and other infrastructure to utilise the bigger space.
Average fulfilment cost per order
Average fulfilment cost per order helps you identify how much you’re spending to pick, pack, and ship an order.
There are severals costs to consider when you look at the entire retail fulfilment process. To calculate total fulfilment costs, look at the following expenses:
- Receiving, storing, and managing inventory
- Standard or custom packaging
- Picking and packing labour
- Shipping labels and postage
- Shipping supplies and shipping costs
- Kitting and assembly (if applicable)
- Return management process
Fulfilment costs vary depending on whether you fulfil in-house or partner with a 3PL (and their pricing model).
Many times, retailers think that continuing to fulfil a high-volume of orders in-house is cost-effective, but there are hidden fulfilment costs to be aware of.
If you partner with a 3PL like ShipBob, the standard pick and pack fees are built into the overall fulfilment cost, which also includes shipping. And since they take care of everything, from warehouse receiving to automated shipping, you save both time and money by focusing your attention on revenue-generating initiatives.
“Last July, Prymal reached $40,000 in revenue. After switching to ShipBob just four months later in November, we are reaching $160,000 a month in revenue — that’s 300% growth. We’re also saving $8,000 per month in fulfilment costs.”
Courtney Lee, founder of Prymal
Gross margin return on investment (GMROI)
How profitable is your inventory in a particular time period? The GMROI ratio can help you answer this question and get your product pricing right based on your profit goals.
Since it’s very common for businesses to have a lot of capital tied up in inventory, this is a crucial metric to keep an eye on.
Here’s a simple formula to calculate:
Gross Margin / Average Inventory Value
Gross margin can be found by subtracting COGS from net sales, and the average inventory is calculated by summing the ending inventory over a specified period and then dividing the sum by the number of periods.
You want to avoid a GMROI that is less than 1, because it means that your business is losing money. On the other hand, achieve a GMROI greater than 1, and you can rest easy knowing that you are selling inventory at a higher selling price than what it cost to acquire it. Of course, you’ll want to make sure acquisition costs and returns, among others, aren’t cutting into this.
Days Inventory Outstanding (DIO)
Days Inventory Outstanding (DIO) is the average number of days that a business holds inventory before selling it. This is a liquidity metric that shows businesses how quickly their inventory can be turned into cash.
Here’s how DIO can be calculated:
(Average Inventory / Cost of Sales) x Number of Days in a Period
Stockout rate
Stockout rate is the percentage of items that are not available to be sold. A stockout occurs when inventory is unavailable and cannot be purchased or shipped. Stockouts can happen for a variety of reasons, so it’s important to stay vigilant and calculate your stockout rate.
This is how stockout rate is calculated:
Number of Products Not in Stock / In-stock Items Available for Sale
Available to promise (ATP)
Available to promise, or ATP, is the amount of inventory your brand has in stock and is not allocated to other customers’ orders. Calculating ATP lets your brand keep a minimum amount of product in the warehouse to cut back on warehousing costs. Available to promise ensures you keep just enough inventory without risking backorders.
Customer service level (CSL)
Customer service level is the expected probability of not hitting a stockout. The CSL represents the trade-off between the cost of inventory and the cost of stocking out (i.e., the hit you take when you lose a sale because you don’t have enough inventory in stock).
How tracking and analising key inventory metrics can benefit your business
Undoubtedly, regularly monitoring and analising key inventory metrics is a critical aspect of effective inventory management. In this section, we discuss why inventory analytics is important and how it helps optimise your online store operations.
Maintain healthy stock levels
When you conduct regular inventory audits and track metrics like total units in storage and shrinkage, it improvesstock visibility.A clear overview ofinventory levels at all times is what will help you decide on how much stock to order and when to reorder.
By holding just enough inventory to meet customer demand while avoiding excess or stale stock, you gain more control over your business.
“We have a Shopify store but do not use Shopify to track inventory. In terms of tracking inventory, we use ShipBob for everything — to be able to track each bottle of perfume, what we have left, and what we’ve shipped, while getting a lot more information on each order. The analytics are super helpful.
We download Excel files from the ShipBob dashboard all the time and use them to analyse everything from cancelations, to examining order weights, to checking on whether ShipBob is shipping orders on time. Even the way their warehouse receiving orders (WROs) work for sending inventory is very straightforward.”
Ines Guien, Vice President of Operations at Dossier
Avoid inventory waste
If you want to run a tight ship and build a sustainable supply chain, every item purchased must be accounted for. You can increase the value of a company’s inventory, and in turn the revenue, by reducing inventory write-offs and write-downs.
To make better inventory optimisation decisions, consider implementing tools and systems that help you track important inventory metrics using automation.
Since inventory is constantly moving throughout the supply chain, inventory automation tools and other systems can help you ensure you’re not leaving any money on the able.
“We also have easy ways to manage subscription orders as well as expiration dates and lot numbers, so inventory goes in First In, First Out (FIFO).”
Leonie Lynch, Founder & CEO of Juspy
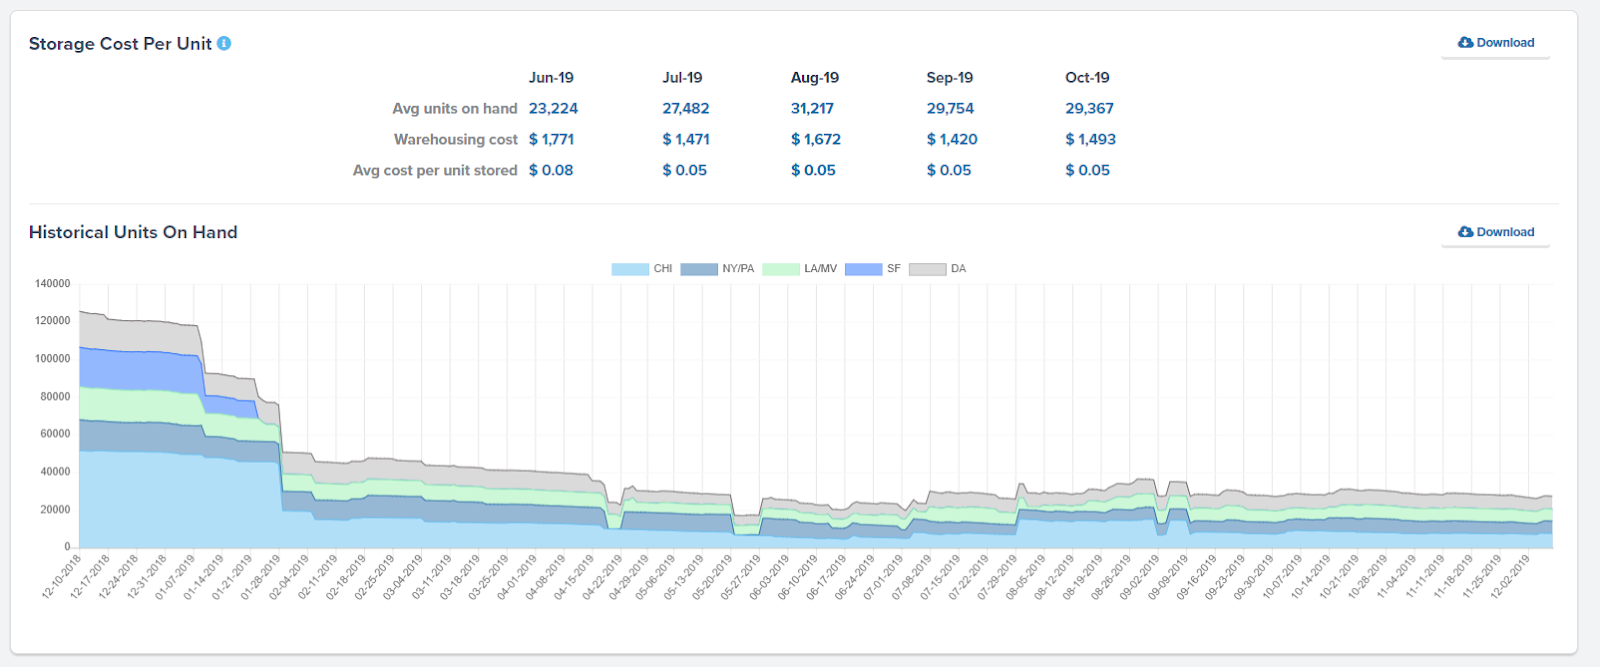
Reduce inventory costs
30-50% of your assets are likely to be tied up in inventory. Naturally, the cost of inventory also tends to be high.
The right analytics can help you identify the causes for higherinventory holding costs, capital costs, inventory service costs, and inventory risk costs. Based on the data, you can take steps to remedy these issues to positively impact the bottom line.
For instance, ShipBob makes it easy to track storage, fulfilment, and other costs by tracking inventory activity (what’s incoming and what’s leaving) in real time.
“ShipBob’s technology provides cost savings. Other 3PLs pass fees onto the client for work they do related to manual processes because they lack the fulfilment technology needed to meet customer expectations.”
Carl Protsch, Co-Founder of FLEO
Limit the number of backorders
It reflects poorly on your business if you have too many backorders. To improve stock availability, you will need data and real-time inventory insights, so you can make make intelligent, data-backed stocking decisions.
For instance, analising insights such as historical order data can help you project future sales and stock accordingly. This will reduce stockout costsand minimise backorders.
“For inventory planning, I love the SKU velocity report, daily average products sold, and knowing how much inventory we have left and how long it will last. The enhanced visibility is great.
With my old 3PL, I could never just open a page and get the info I wanted. I had to click several times, then export it, and try to make sense of it. ShipBob lets you manage your inventory while providing important data in a very digestible way.”
Wes Brown, Head of Operations at Black Claw LLC
Know when to order more inventory
Inventory replenishment can be a tricky process to get right, especially since demand can constantly fluctuate.
By analising first-mile delivery timelines and inventory turnover rate, you make better decisions on when it’s time to restock inventory using the reorder point formula:
Reorder Point (ROP) = Demand During Lead Time + Safety Stock
To make this process easier, ShipBob provides the insights you need to check in on inventory activity, view historical data, and set automatic reorder points based on your findings.
When inventory levels reach a minimum threshold, you are notified when stock is running low.
“ShipBob’s analytics tool is also really cool. It helps us a lot with planning inventory reorders, seeing when SKUs are going to run out, and we can even set up email notifications so that we’re alerted when a SKU has less than a certain quantity left. There is a lot of value in their technology.”
Oded Harth, CEO & Co-Founder of MDacne
Streamline cash flow
Streamlining your brand’s cash flow requires finding a balance of maintaining enough inventory without having too much cash tied up.
There are various ways you can optimise your cash flow to keep your business running smoothly. Align your biggest expenses with your industry’s revenue pattern (i.e., if you sell swimwear, plan your payments in the late-summer or early-fall) and forecast your cash flow accordingly.
Additionally, you can increase cash flow by running promotions to boost sales or boosting your average order value.
Improve customer satisfaction
Customer satisfaction is one of the most important metrics to keep track of. This measures the health of your business and helps you finetune areas that can improve the shopper’s experience and overall satisfaction with your brand.
There are a multitude of options you can implement to improve your customer satisfaction – ranging from small tweaks to larger optimisations. Everything from adding little freebies at pack, using custom packaging, and showcasing Prime-like shipping badges to switching to more sustainable practices, offering free shipping, and expanding your reach globally can help improve customer satisfaction.
Best practices for analising inventory
Analising your inventory can seem daunting at first. There are many steps and methodologies to consider which can make the process seem complicated. To help you make the most of your inventory analysis, utilise these best practices.
Centralise the data
Centralising your data gives your brand a single source of truth. Centralised data provides your company with a blueprint to work around to ensure all departments are aligned. This results in improved data integrity, and valuable tracking and reporting. This increased understanding of your business’s data helps you better analyse what is going well and what you can optimise.
Track and analyse data in real-time
Real-time analytics allows you to see data unfolding as it happens. Tracking and analising data in real-time gives you the chance to be proactive and take immediate action to course-correct or seize opportunities as they arise.
Regularly audit inventory levels
By performing inventory audits, you’re able to keep track of your inventory and better gauge your inventory levels.
With ShipBob’s proprietary software, you can view your inventory so you know when’s the best time to replenish so you can forecast demand and avoid stockouts. ShipBob sends you alerts based on your store’s order history so you don’t have to manually calculate your reorder points.
Categorize inventory items
Categorizing inventory is important for any ecommerce business, but it’s especially important for brands with many SKUs. There are various classifications you can use when grouping your inventory.
Using the various analysis methodologies outlined above (i.e., ABC, HML, SDE, etc.) helps you understand your items’ profitability and value to your business. Another way to categorize inventory is by separating your products into different groups. For example, a skincare brand with numerous SKUs may sort products into groups such as cleansers, serums, and moisturizers.
Write detailed inventory analysis reports
Once you’re able to pull your inventory data, a best practice is putting it into a report to analyse. However, taking all of this data and pulling it into one report can seem like a time-consuming and tedious process.
ShipBob’s free analytics tool gives you a centralised place to track all of your inventory metrics in one place. It helps you analyse the efficiency and costs across different aspects of your inventory management and fulfilment processes so you can identify opportunities for optimisation.
Automatically analyse your inventory with ShipBob
At ShipBob, we understand that transparency and visibility is an essential component of building an agile supply chain.
Technology plays a major role in how ShipBob operates as a fulfilment company. In fact, our entire global fulfilment infrastructure is powered by premium fulfilment technology with built-in real-time inventory tracking tools.
ShipBob customers have the opportunity to split inventory across our logistics network and easily track, measure, and analyse supply chain performance from one dashboard using the free data and analytics reporting tool.
From the ShipBob dashboard, you can track important supply chain analytics related to:
- Fulfilment performance and SLAs
- Current inventory distribution vs ideal distribution
- Transit times, shipping methods, and destinations
- Historical stock levels
- Logistics costs associated with storage, fulfilment, and shipping

From improvinginventory allocation to providing insights to help you forecast demand and reduce costs, ShipBob can help supercharge your supply chain, so you can continue to expand and grow your business with ease.
“We are very impressed by ShipBob’s transparency, simplicity, and intuitive dashboard. So many 3PLs have either bad or no front-facing software, making it impossible to keep track of what’s leaving or entering the warehouse.
On the supply chain side, I just throw in what we placed at the factory into a WRO in the ShipBob dashboard, and I can see how many units we have on-hand, what’s incoming, what’s at docks, and so on. I can see all of those numbers in a few seconds, and it makes life so much easier.”
Harley Abrams, Operations Manager of SuperSpeed Golf, LLC
To learn more about ShipBob’s fulfilment capabilities and inventory analytics, click the button below for custom pricing and more information.
Inventory Analytics FAQs
Are there different methods of inventory analysis?

Yes, and it all depends on what you’re looking to learn. For instance, calculating carrying costs can give you insight into how much it costs to store inventory before it’s sold. While finding the average inventory turnover rate offers insights into sales and inventory performance at the SKU level. Finally, the GMROI formula can give you deeper insights into inventory performance and how to improve.
What are inventory metrics?
Inventory metrics involve calculations and formulas that help you analyse how well inventory is performing, how much stock to have on hand to meet demand, how much it costs to receive and store inventory, how often inventory sits on the shelves before it’s sold, and more. These metrics are best tracked using technology and real-time tracking tools to provide accuracy and reduce human error.
What inventory metrics does ShipBob provide?
ShipBob’s built-in inventory management tools collect and record inventory flow throughout the supply chain in real time. This way, you can analyse different stages of inventory, including warehouse receiving performance, inventory turnover rate, ideal inventory distribution, average fulfilment cost per order, storage costs, and much more.